
Powerful graphs and reports
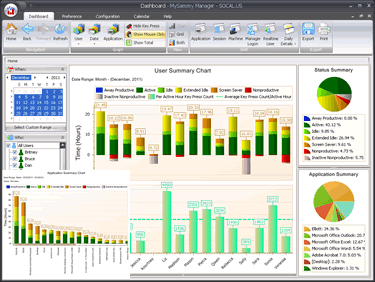
A multitude of administrative color coded graphs and charts are available to help you track your productive active, idle and non-productive activity. Track a user's day-by-day activity or analyze multiple users. With just a few clicks, view application details for a selected time period or session data, and much more.